Make Shiny Fast
…by doing as little work as possible
February 2, 2018
Optimization Loop Method

The call stack
Code
inner <- function(x) {
  stop("oh no")
}
middle <- function(x) { x }
outer <- function(x) { x }

outer(middle(inner()))
Each call creates a frame on the call stack
Stack

Call stack over time
outer(middle(inner()))
outer(middle(inner()))
outer(middle(inner()))
🤔
delay <- function(expr) {
  profvis::pause(1)
  force(expr)
}

delay(delay(delay(1)))
What if width represented duration?

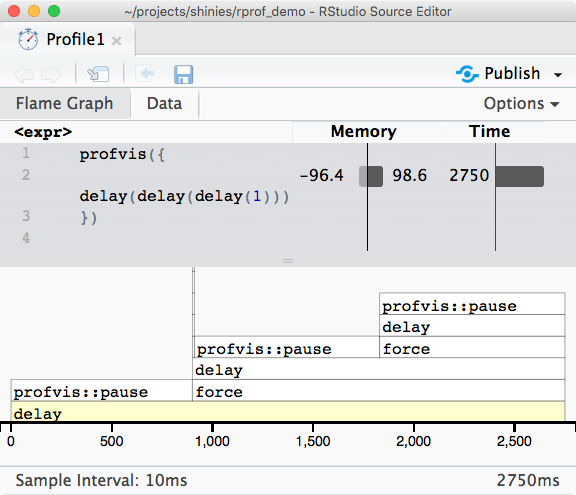
profvis in action
library(profvis)
delay <- function(expr) {
  profvis::pause(1)
  force(expr)
}

profvis({
  delay(delay(delay(1)))
})
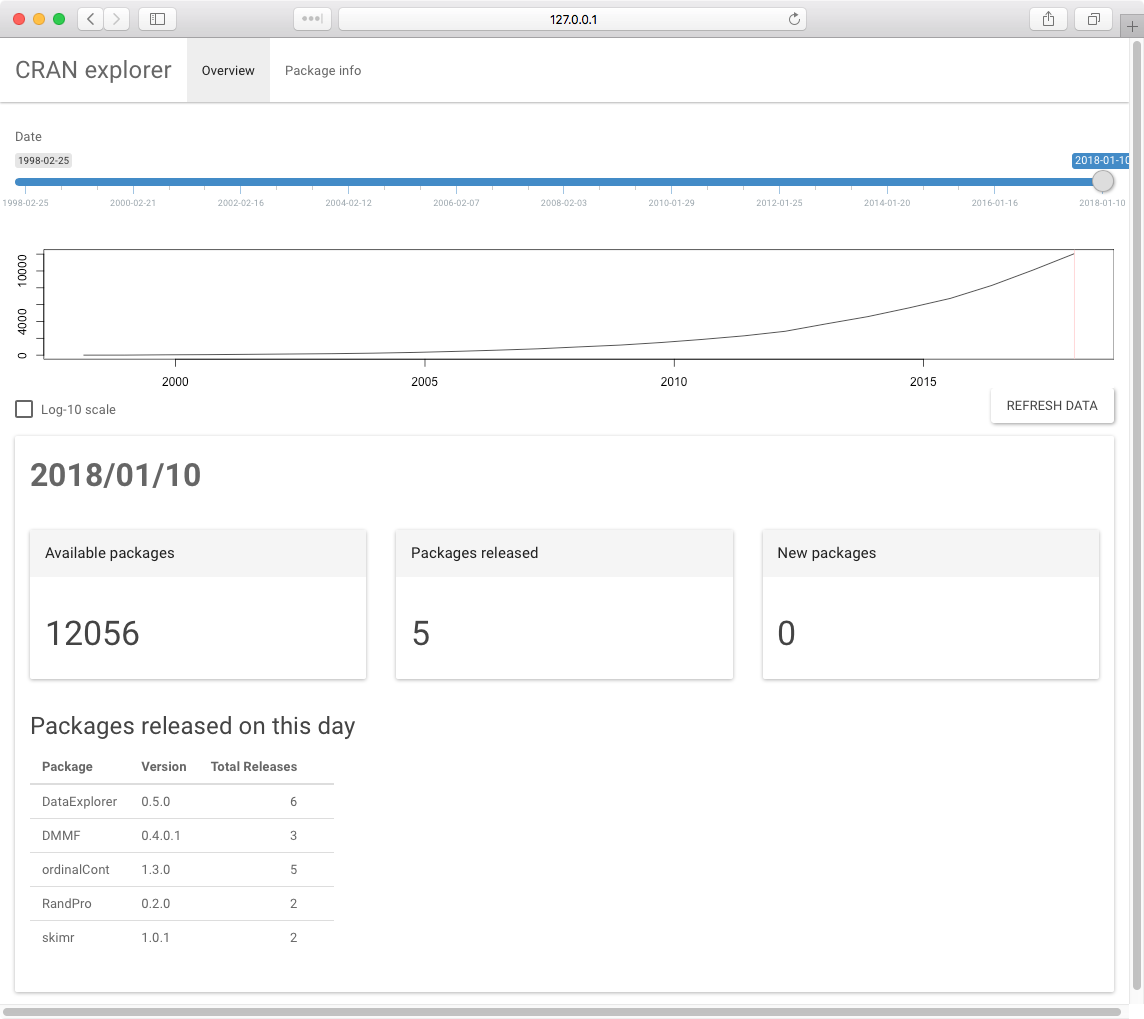
CRAN explorer
Optimization #4: Plot caching
plotCache: read-through cache for plots- Coming soon to Shiny